`theme_glyph()` provides a customized theme for glyph maps, built on top of `theme_map()` from `ggthemes`. It adjusts the plot's appearance, including the legend position, text styles, and background settings, to create a clean, visually consistent layout for glyph visualizations.
Arguments
- control
A list specifying the relative font sizes for different plot elements. The list can contain the following components:
- plot.title
Font size for the plot title (default:
rel(1.5)).- plot.subtitle
Font size for the plot subtitle (default:
rel(1.3)).- plot.caption
Font size for the plot caption (default:
rel(1)).- legend.text
Font size for the legend text (default:
rel(1)).- legend.title
Font size for the legend title (default:
rel(1)).
Details
This theme includes:
Legend positioned inside the plot, at the bottom left corner.
Horizontal legend direction with `mono` font for text.
Centered plot titles with bold, `mono` font.
`mono` fonts for subtitles and captions.
White background for both the panel and plot.
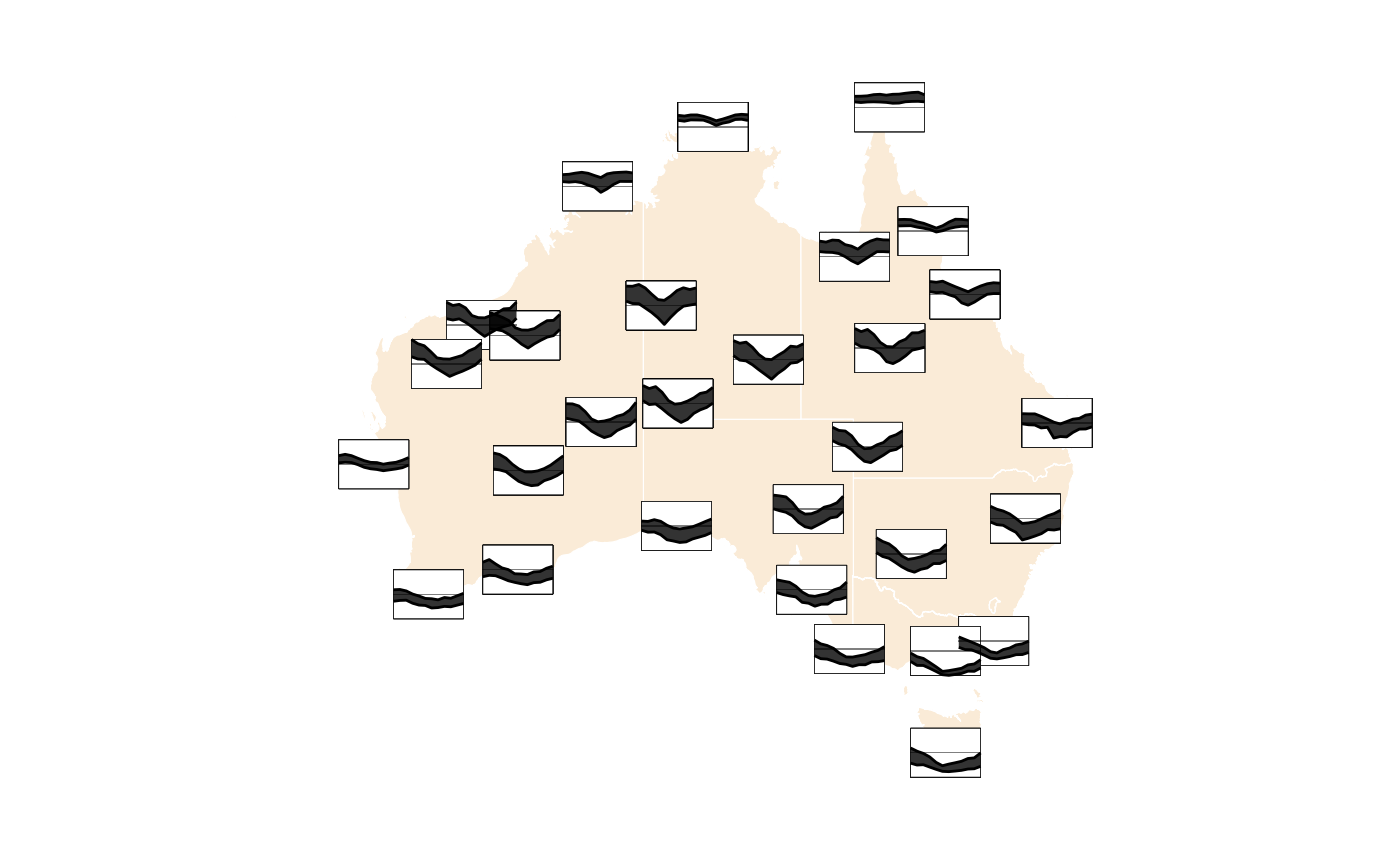
Examples
library(ggplot2)
library(ozmaps)

aus_temp |>
  ggplot(aes(x_major = long, y_major = lat,
             x_minor = month, ymin_minor = tmin,
             ymax_minor = tmax)) +
 geom_sf(data = abs_ste, fill = "antiquewhite",
         inherit.aes = FALSE, color = "white") +
 add_glyph_boxes() +
 add_ref_lines() +
 geom_glyph_ribbon() +
 theme_glyph()